You are here
Maps
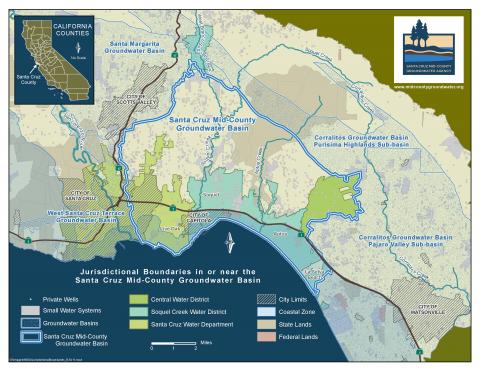
MGA Jurisdictional Boundary Map (with cities)
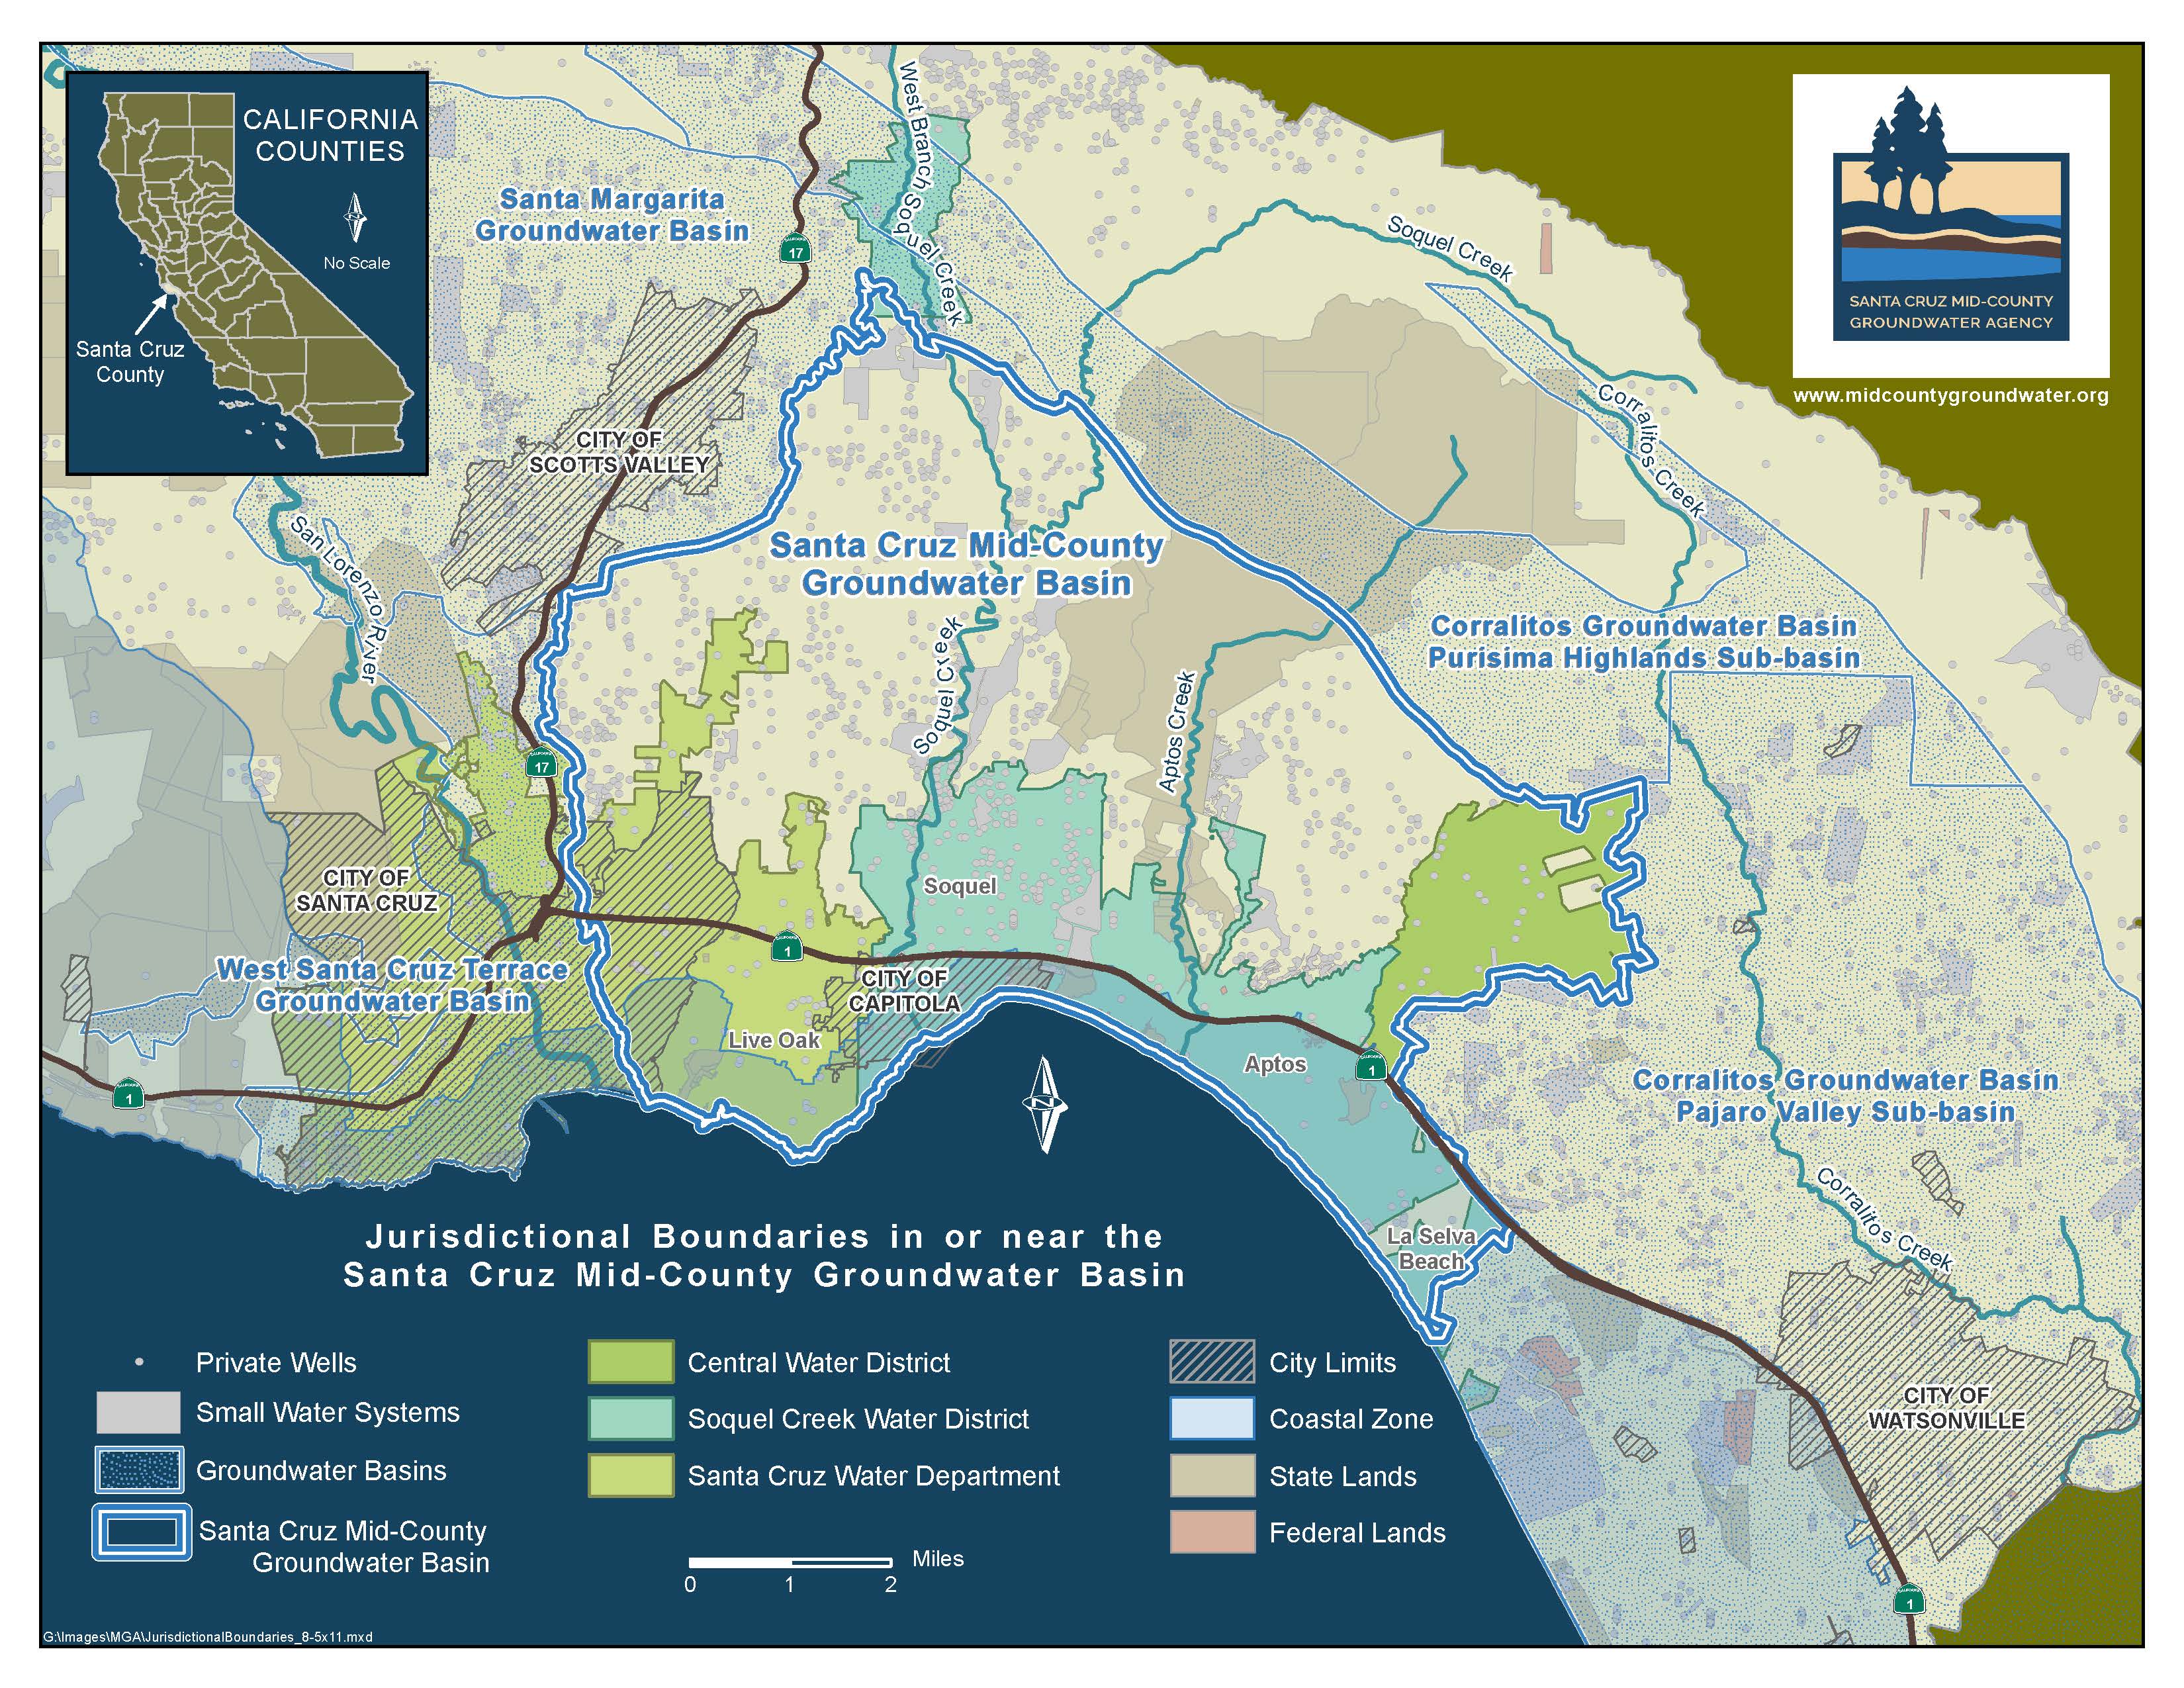
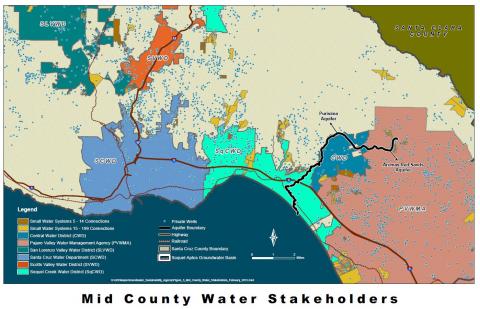
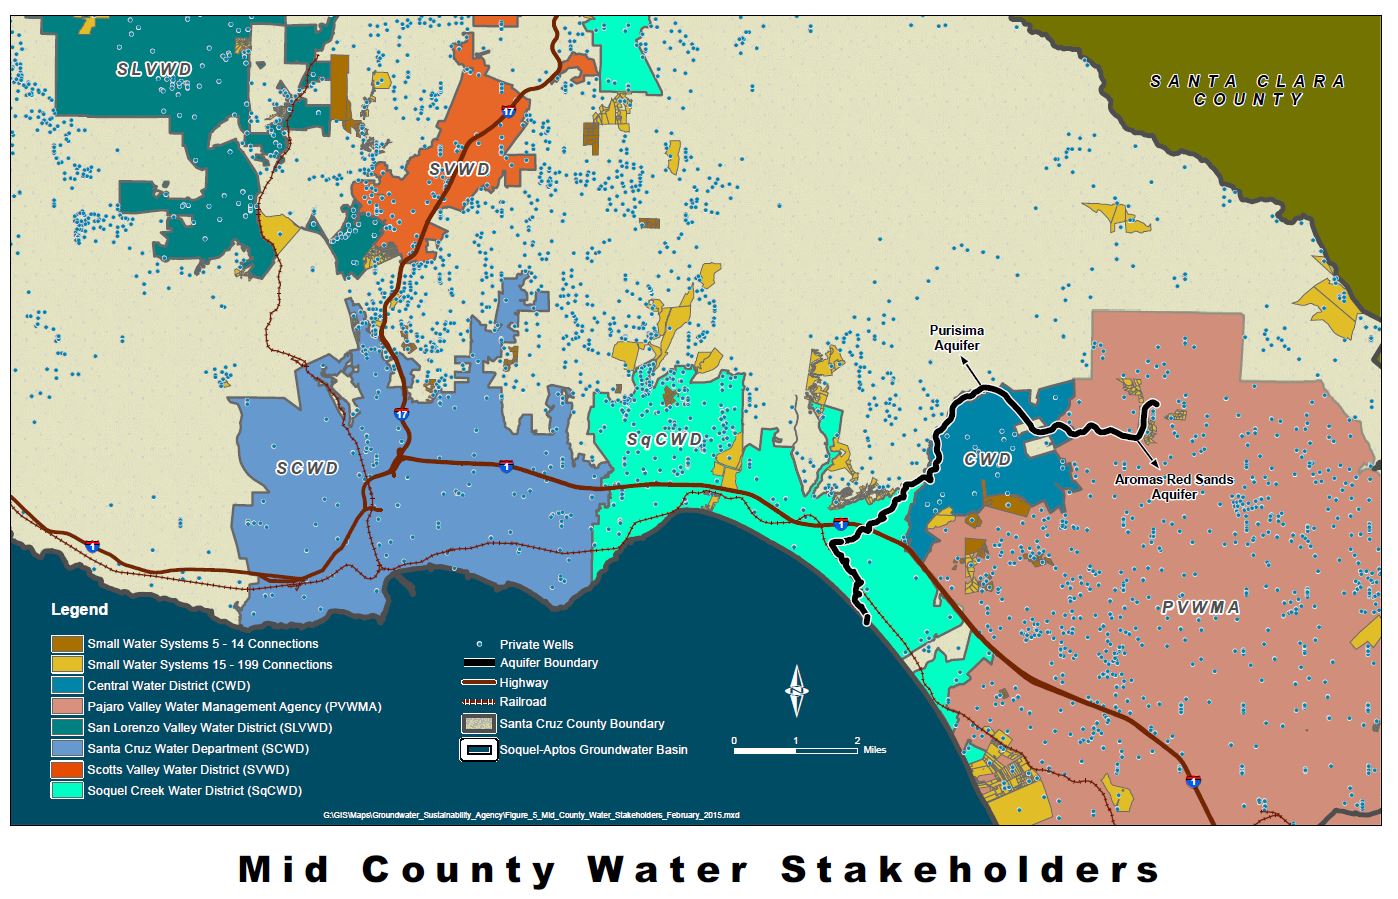
MGA Stakeholder Map (with private well data)
")
")
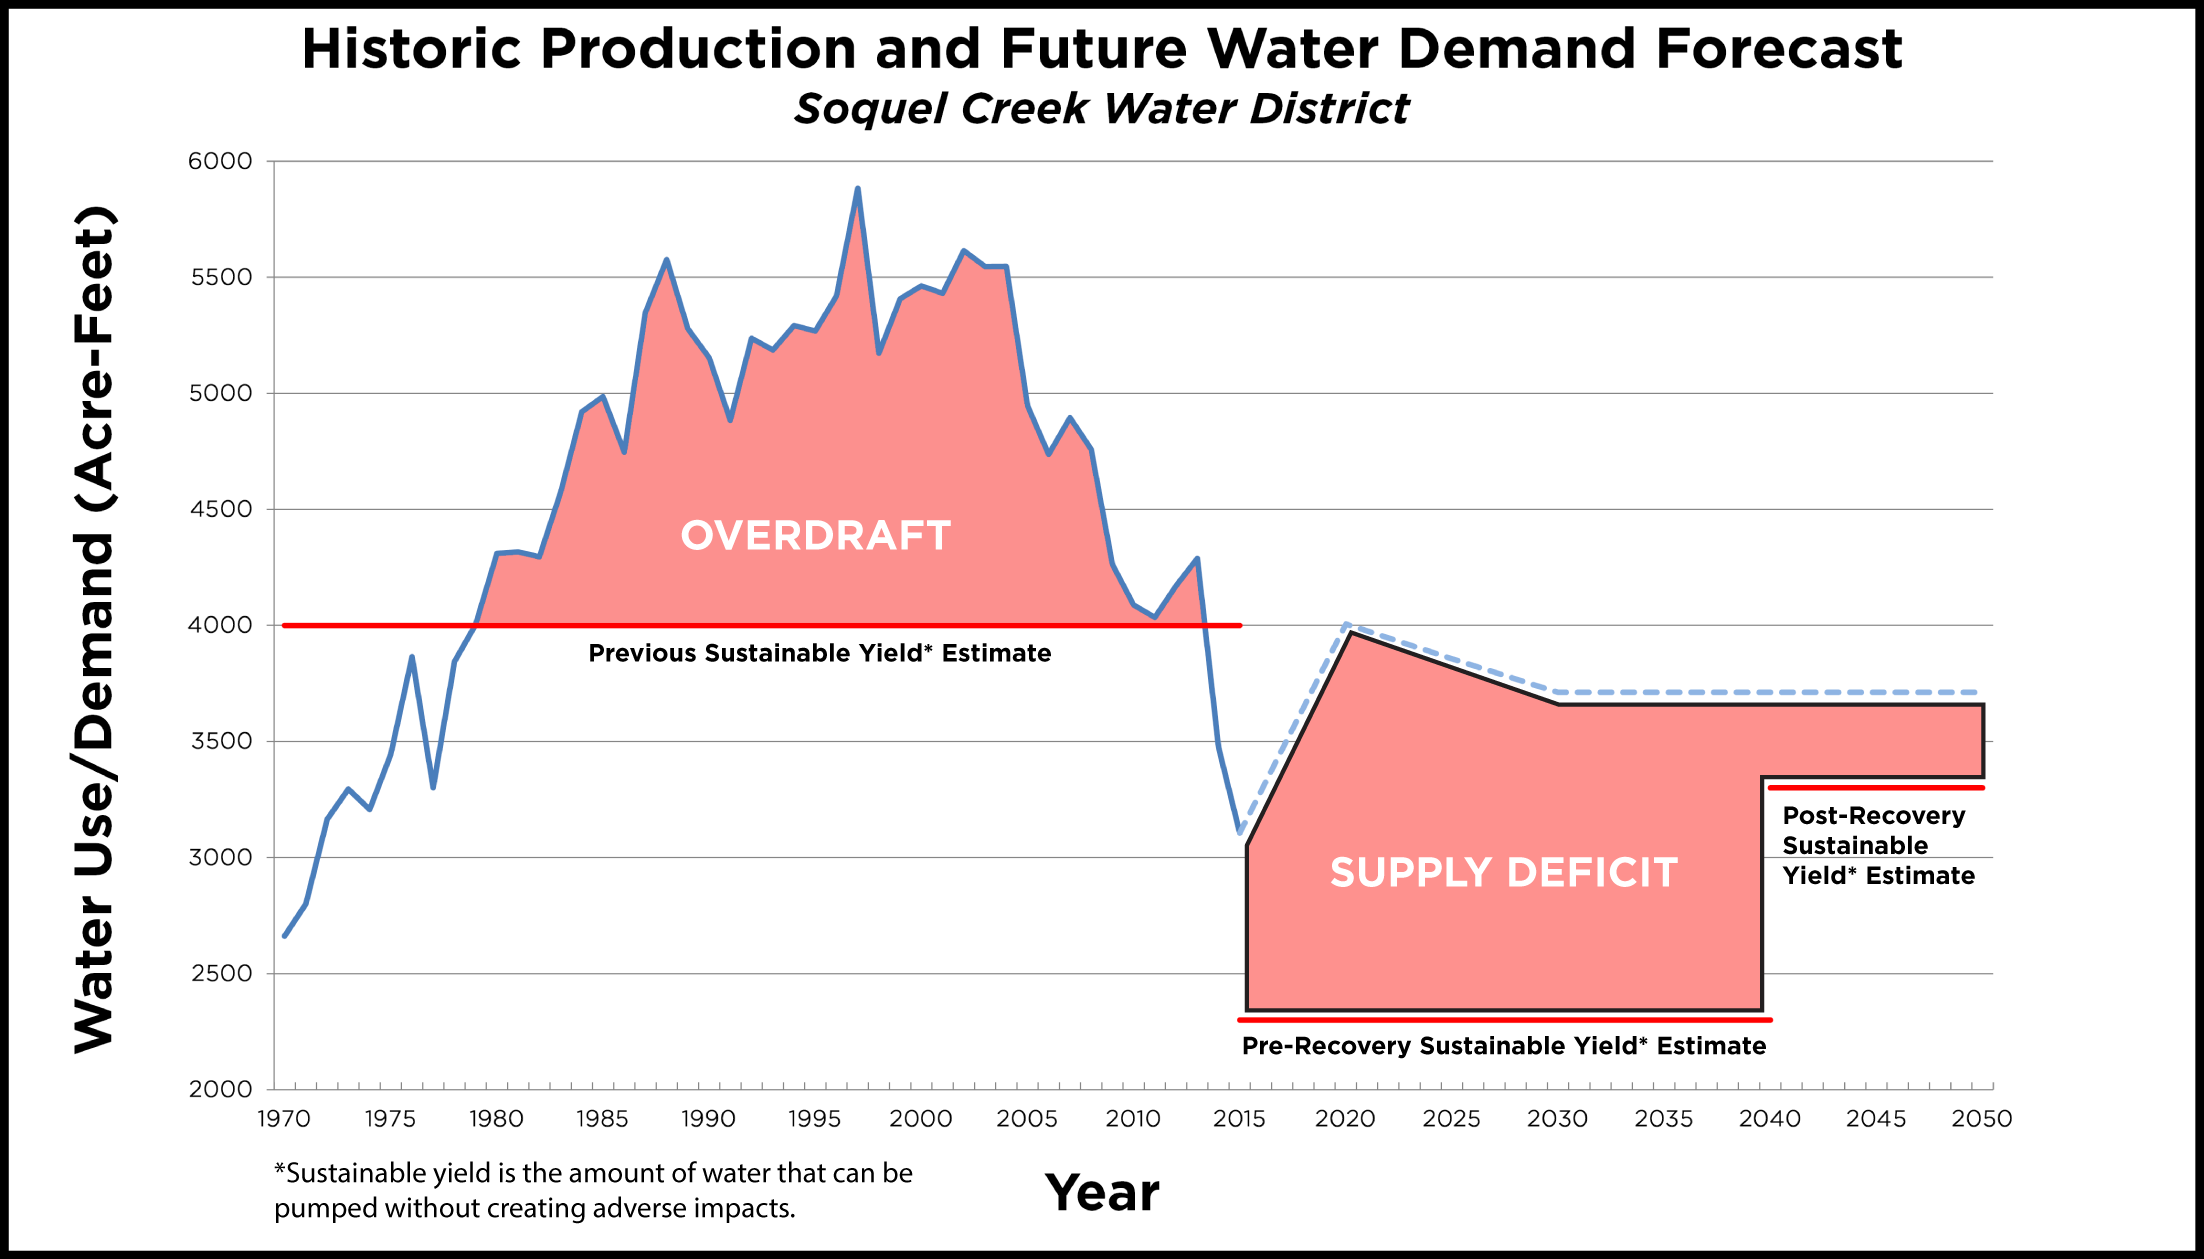
Overdraft of the Groundwater Basin

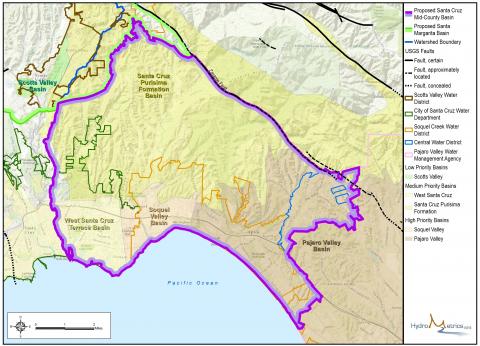
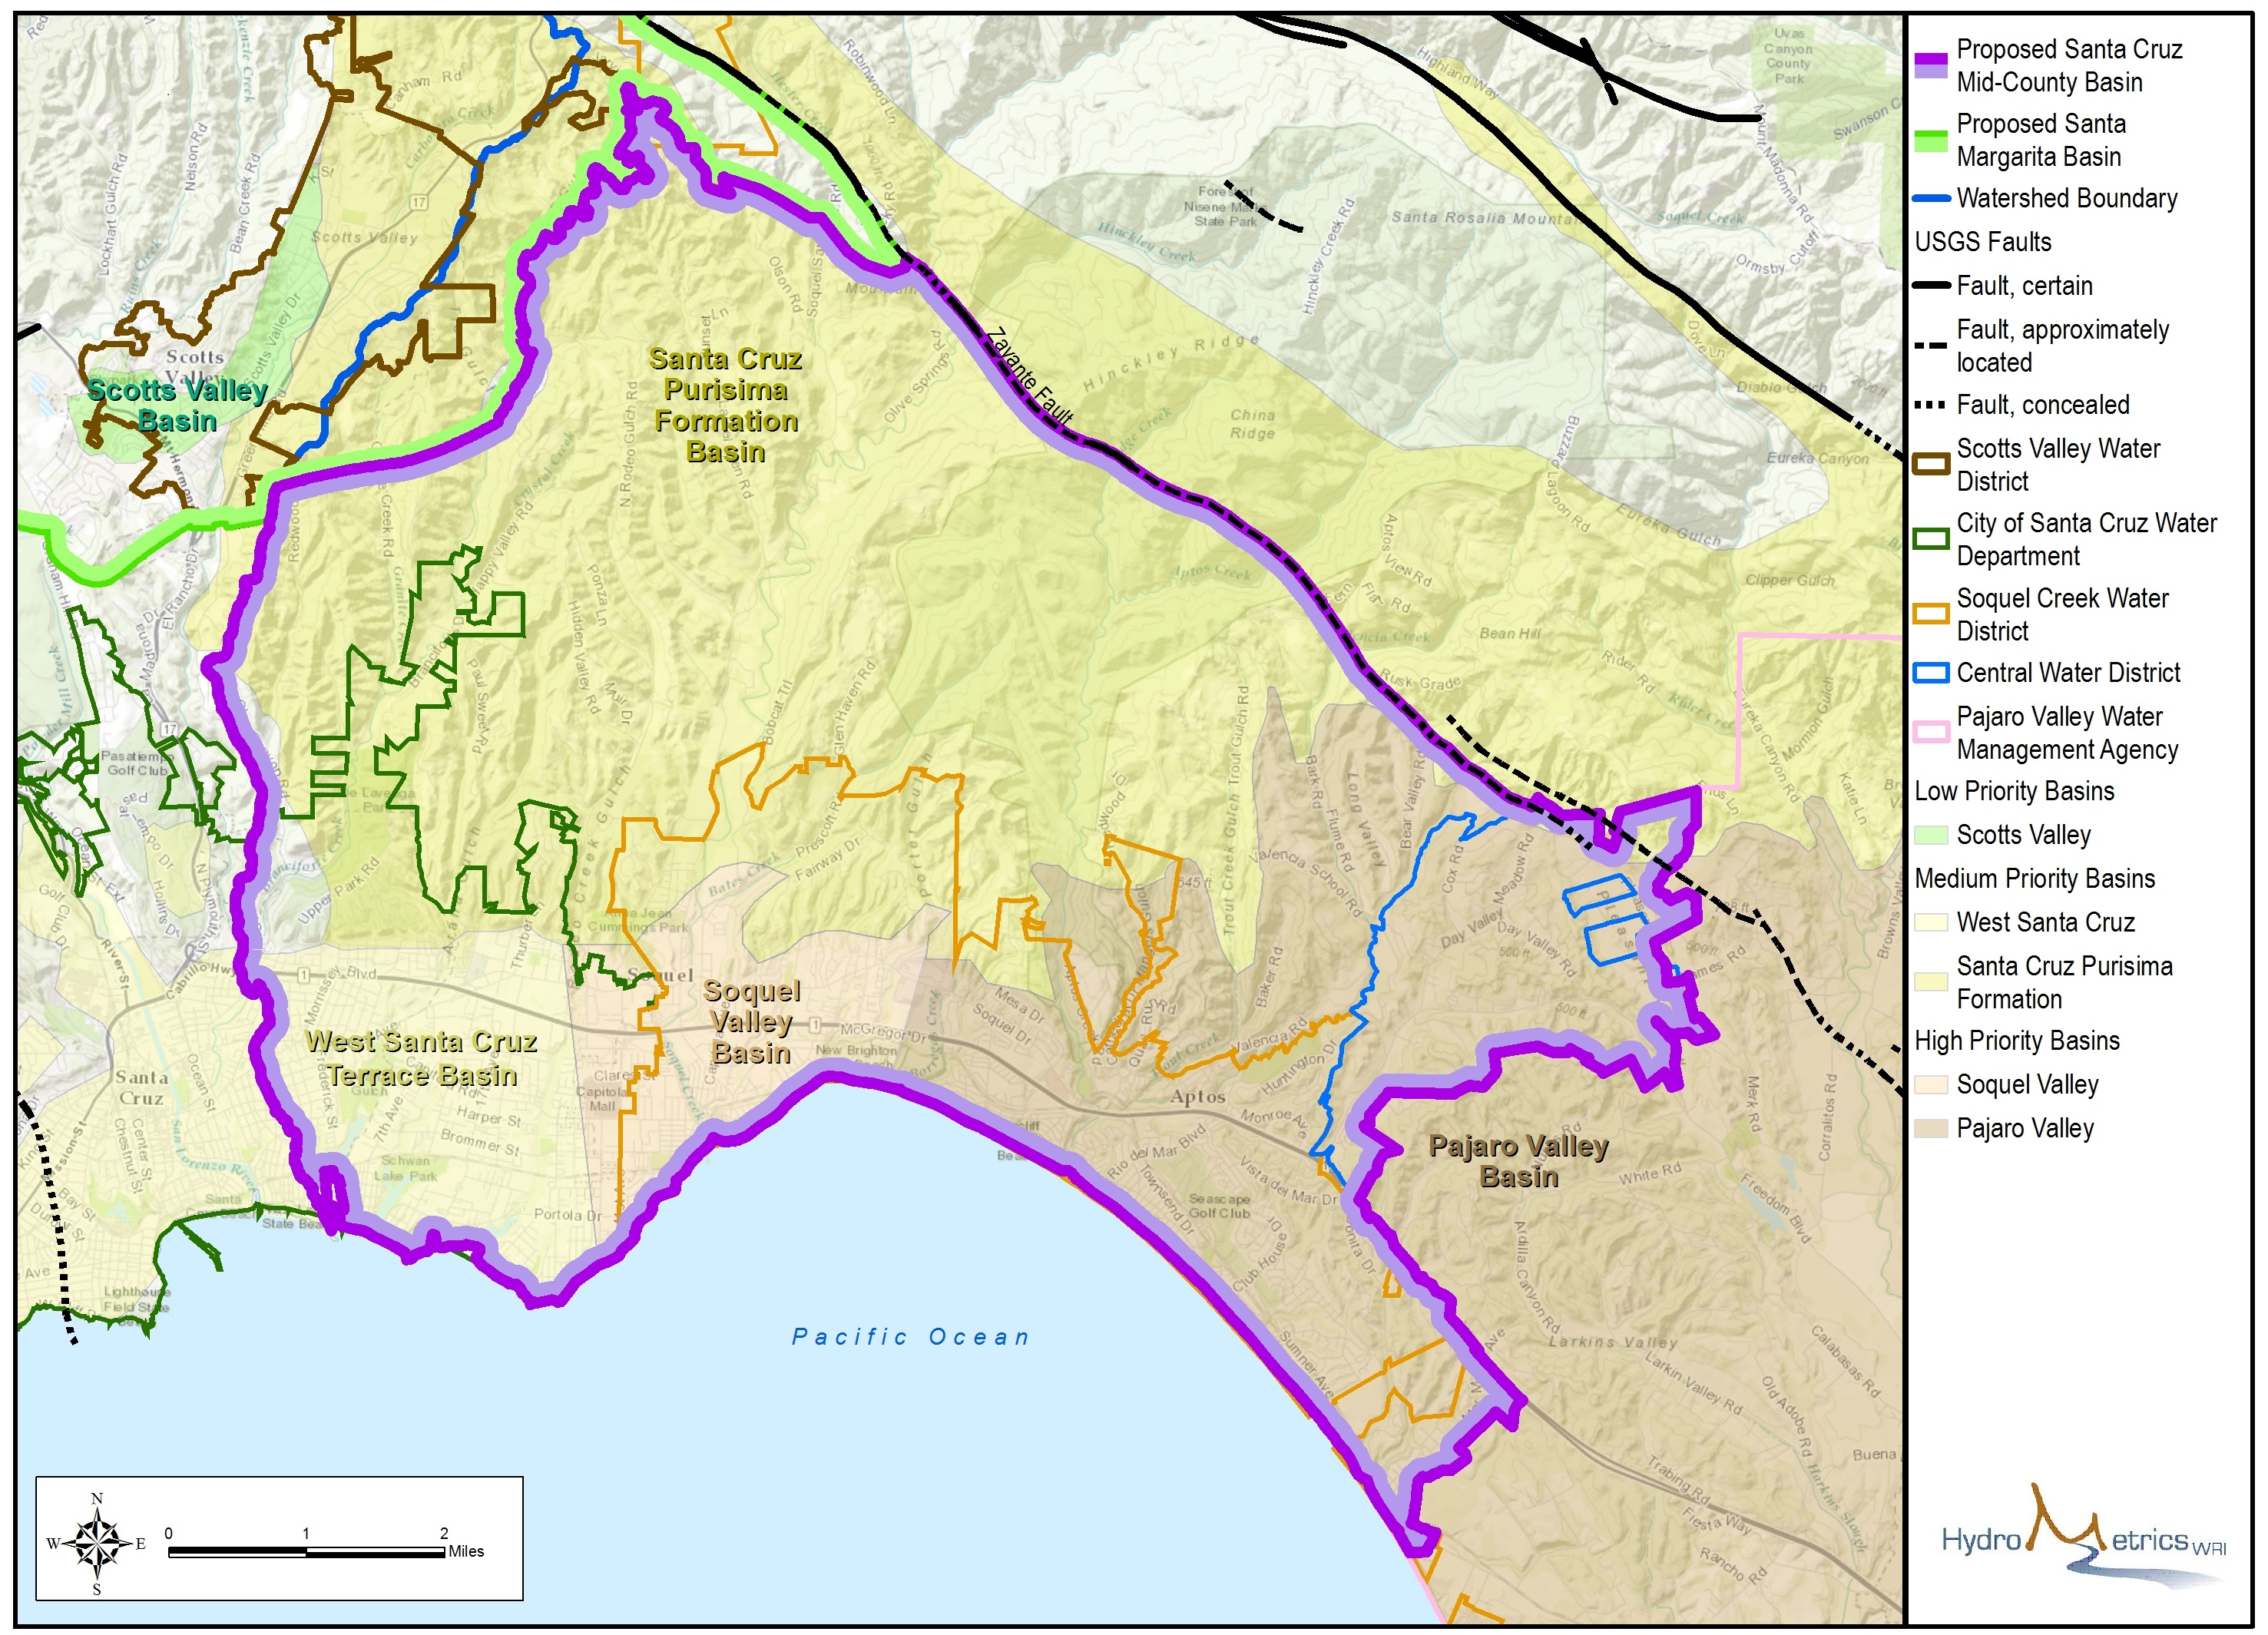
Proposed Basin Boundary
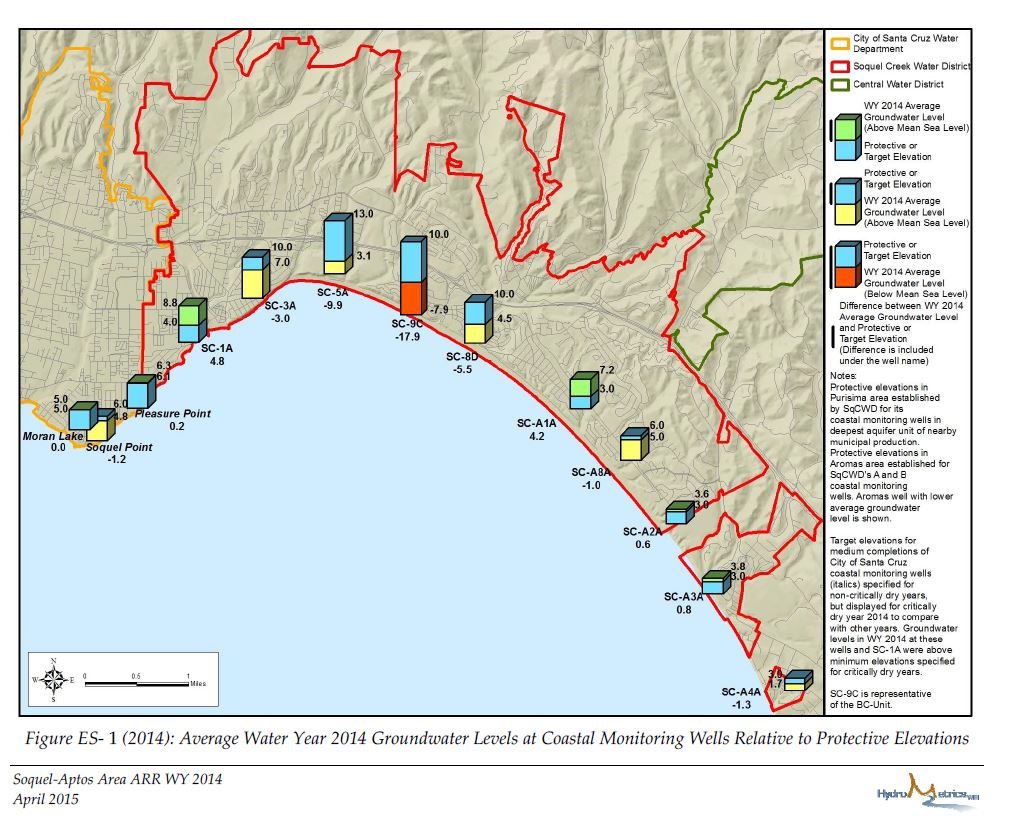
2014 Groundwater Levels

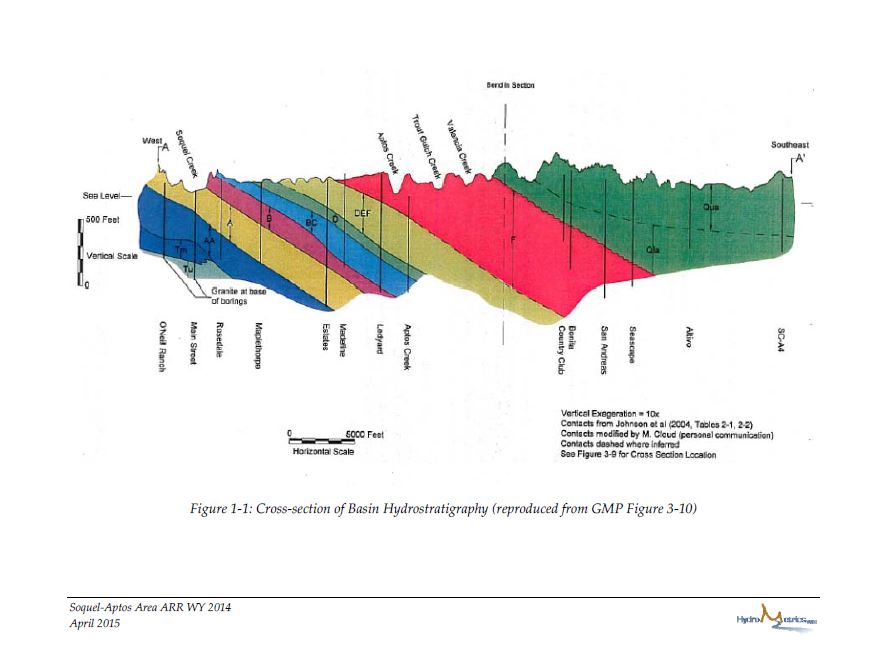
Cross Section of Basin Hydrostratigraphy

Groundwater Recharge


Basin Users in SC County
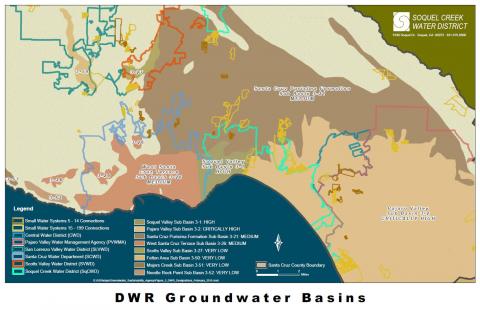
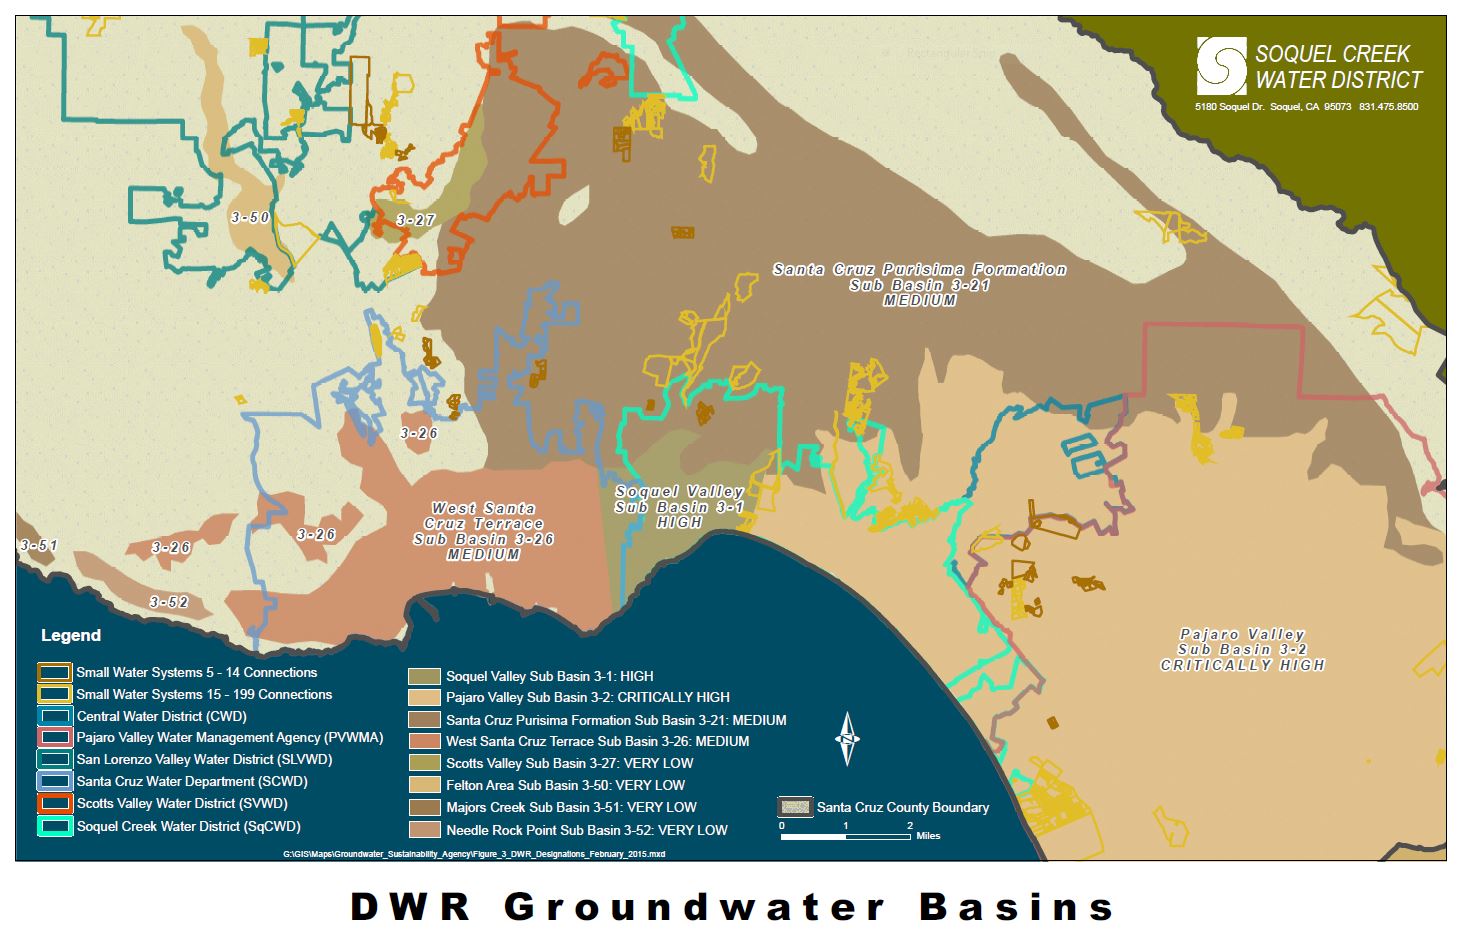
DWR Bulletin 118 Basins
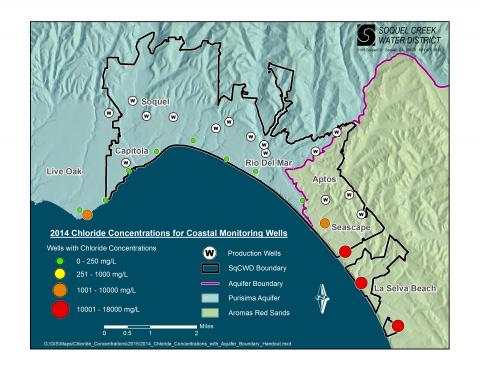
Seawater Intrusion at Coastline